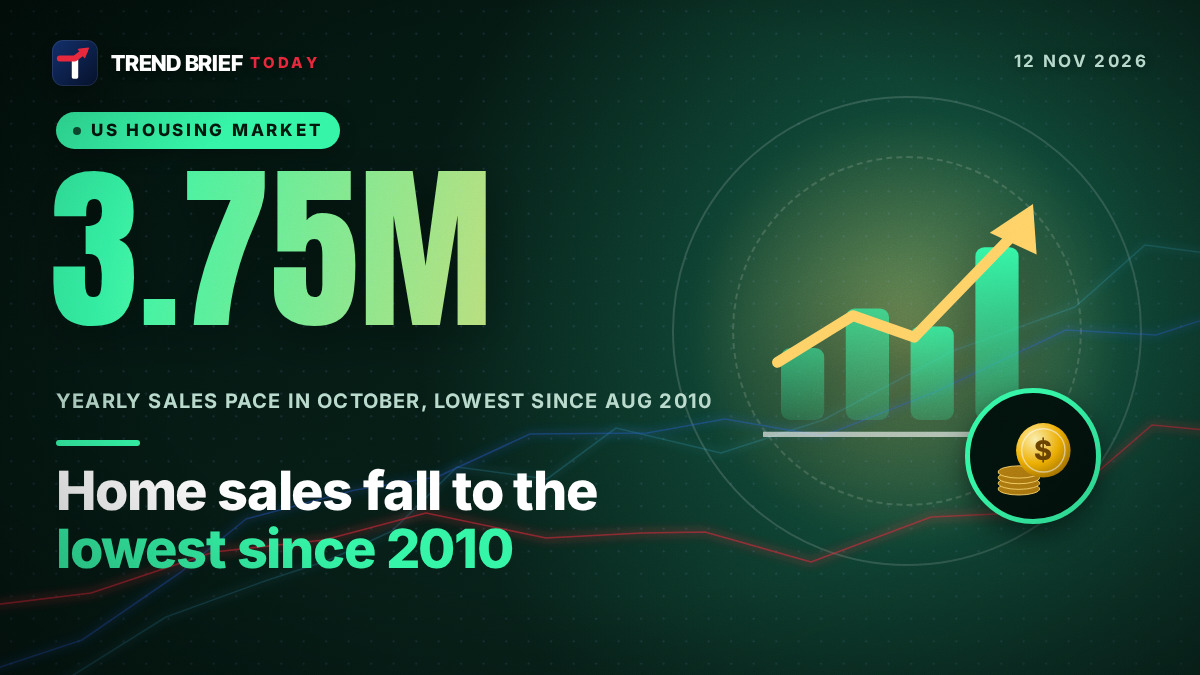
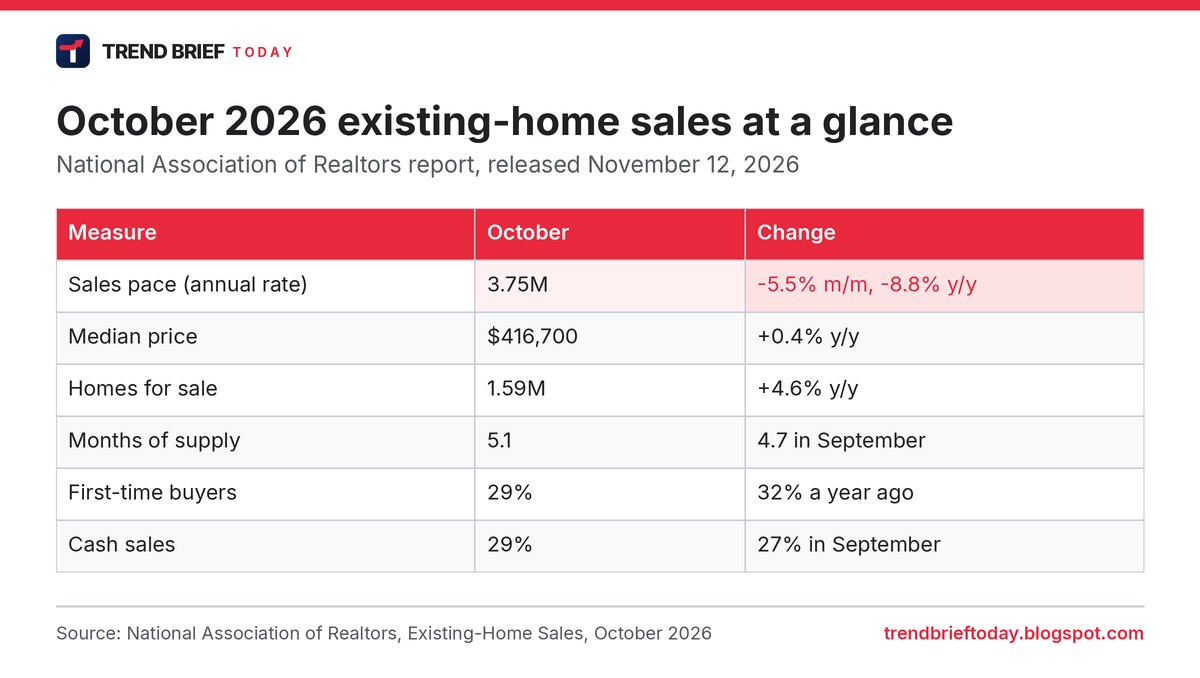
US home sales fell to their lowest level in 16 years in October 2026. The National Association of Realtors (NAR) said on Thursday, November 12, that existing-home sales dropped 5.5% from September to a seasonally adjusted annual rate of 3.75 million, the slowest pace since August 2010.[1][2][4] Sales were down 8.8% from a year earlier, yet the median price still rose 0.4% to $416,700. NAR's chief economist blamed mortgage rates, which averaged 7.33% in October.[1][4]
 | |
| Released | Thursday, November 12, 2026, by NAR[1][6] |
|---|---|
| Sales pace | 3.75 million a year (seasonally adjusted)[1][3] |
| Change | -5.5% from September, -8.8% from October 2025[1][4] |
| Lowest since | August 2010[1][2] |
| Forecast | 3.85 million[6] |
| Median price | $416,700 (+0.4% a year)[1][3] |
| Homes for sale | 1.59 million, a 5.1-month supply[1][5] |
| 30-year rate | 7.33% October average; 7.11% on November 12[1][8][9] |
What the October report says
Existing homes are houses, townhomes, condos and co-ops that someone already owned, and they make up more than 90% of US home sales. NAR counts closed sales, so October's number mostly reflects contracts signed in August and September.[1][6]
The pace fell to 3.75 million a year. That is down from 3.99 million first reported for September and below the 3.85 million that economists expected.[6][7] Calculated Risk called it "a new cycle low" and noted that sales have been very low for four years now.[5] Major outlets, including the Wall Street Journal and Bloomberg, led with the same point: the weakest month since 2010, when the market was still digging out of the 2008 crash.[2][10][11]
Lawrence Yun, NAR's chief economist, put it plainly: "Home buying is difficult when mortgage rates have climbed to their highest levels since 2000, aside from a single month in 2023. As a result, home sales fell to their lowest level since August 2010."[1][4] He told Yahoo Finance it is "just a tough market for buyers and sellers trying to get that transaction".[2]
Why sales fell: mortgage rates above 7%
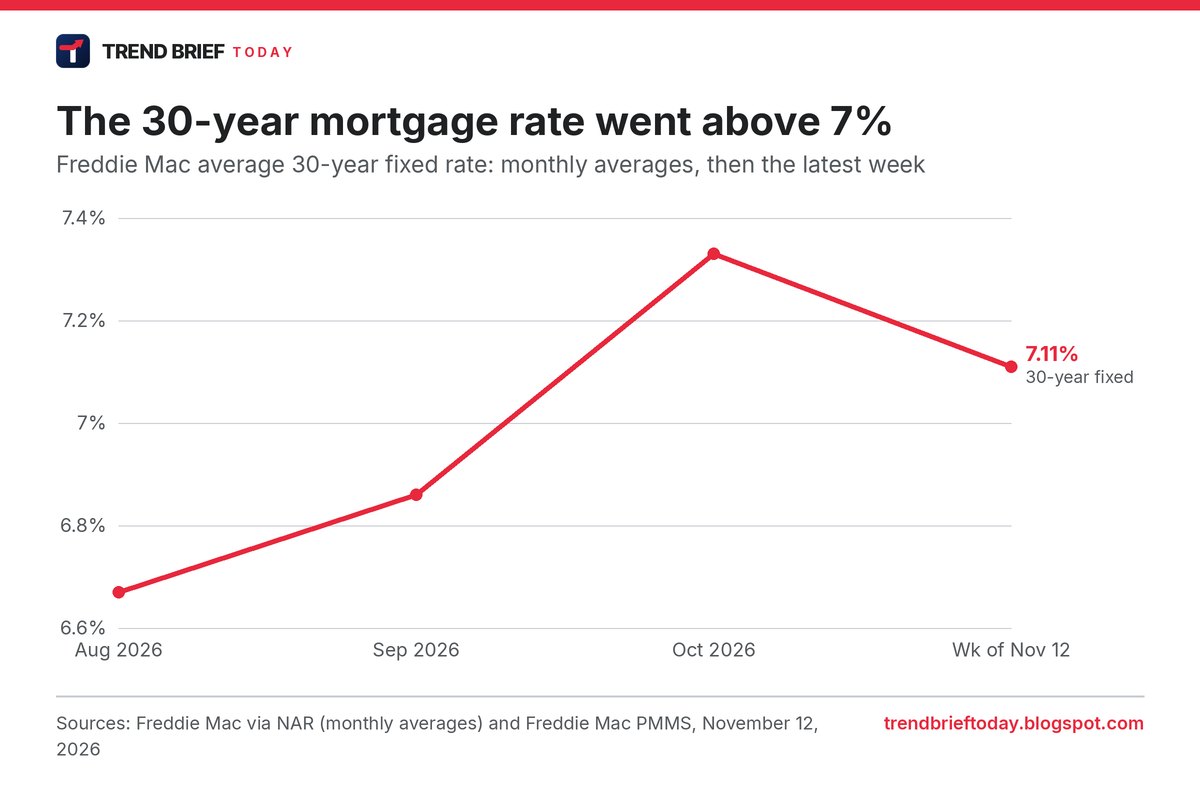
The 30-year fixed rate averaged 7.33% in October, up from 6.86% in September and 6.25% a year earlier, according to Freddie Mac figures quoted by NAR.[1][4] Yahoo Finance points out that rates crossed 7% in September, but the hit to closed sales came a month later, because many September buyers had already locked in a rate below 7%.[2]
There is a small bit of relief. Freddie Mac's weekly survey on November 12 put the 30-year rate at 7.11%, down from 7.18% a week earlier and the fourth weekly drop in a row. It peaked at 7.40% in the weeks of October 8 and October 15.[8][9] It is still far above the 6.24% of a year ago, and the 15-year rate is 6.45%.[9] Rates also react to inflation news; our October CPI explainer covers the latest US inflation numbers.
Selma Hepp, chief economist at the property data firm Cotality, told HousingWire that affordability "remains a major constraint, particularly when mortgage rates rise above the 7% psychological threshold", and that insurance, property taxes and utility bills are adding to the squeeze.[3] NAR's own Housing Affordability Index fell to 100.7 from 107.3 a year earlier.[1][4]
Why prices are still going up
Fewer sales usually means softer prices, but not yet. The median existing-home price was $416,700, 0.4% higher than a year ago and the 40th month in a row of yearly gains.[1][3] The rise is getting very small, though. In September the yearly gain was 1.3%.[7]
Supply is growing. There were 1.59 million homes for sale at the end of October, up 4.6% from a year earlier, equal to 5.1 months of supply at the current pace. That compares with 4.7 months in September and 4.4 months a year ago.[1][5] Around six months is usually seen as a balanced market, so buyers are slowly getting more choice.[6] Homes also sat longer: 35 days on the market, up from 33 in September.[1][3]
Many owners are staying put because their old mortgage carries a much lower rate, the so-called lock-in effect. That keeps listings tight and is one reason prices have held up while sales slump.[6]
Sales by region
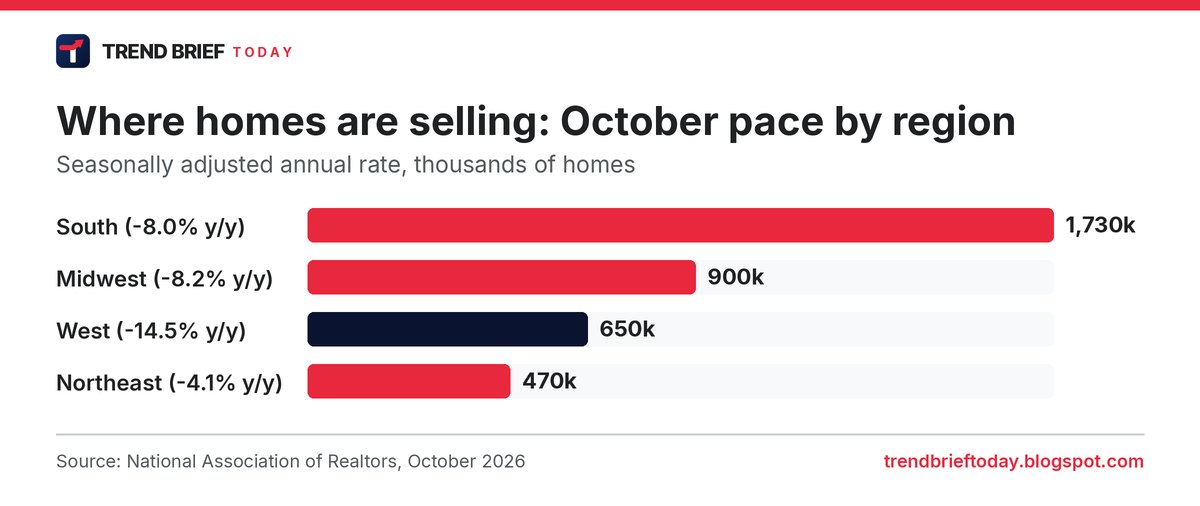
Sales fell from a year earlier in all four regions. The West had the biggest drop, down 14.5% to an annual pace of 650,000 and down 9.7% from September. The South fell to 1.73 million (down 8.0% on the year), the Midwest to 900,000 (down 8.2%), and the Northeast held at 470,000, still 4.1% below a year ago.[1][3][4]
| Region | Median price | Change in a year |
|---|---|---|
| Northeast | $519,600 | +3.2% |
| Midwest | $324,300 | +1.5% |
| South | $360,900 | -0.4% |
| West | $624,300 | Unchanged |
| US | $416,700 | +0.4% |
Source: NAR, October 2026 existing-home sales.[1]
Who is buying now
First-time buyers made up 29% of sales, down from 31% in September and 32% a year ago. Cash buyers were 29% of deals, up from 27% in September. Investors and second-home buyers took 20%, up from 16% a year earlier.[1][3] Distressed sales such as foreclosures stayed at just 2%, which Yun said shows most of the country's 88 million homeowners are in a "comfortable financial position".[1]
Put simply, people who can pay cash or already have big home equity are holding up the market, while first-time buyers who need a mortgage are being priced out.
What it means for buyers and sellers
We ran the numbers on a median-priced home. With 20% down on $416,700, the loan is $333,360. At 7.11%, principal and interest come to about $2,243 a month. At last year's 6.24%, the same loan cost about $2,050. That is roughly $192 more every month, or about $2,300 a year, before taxes and insurance.
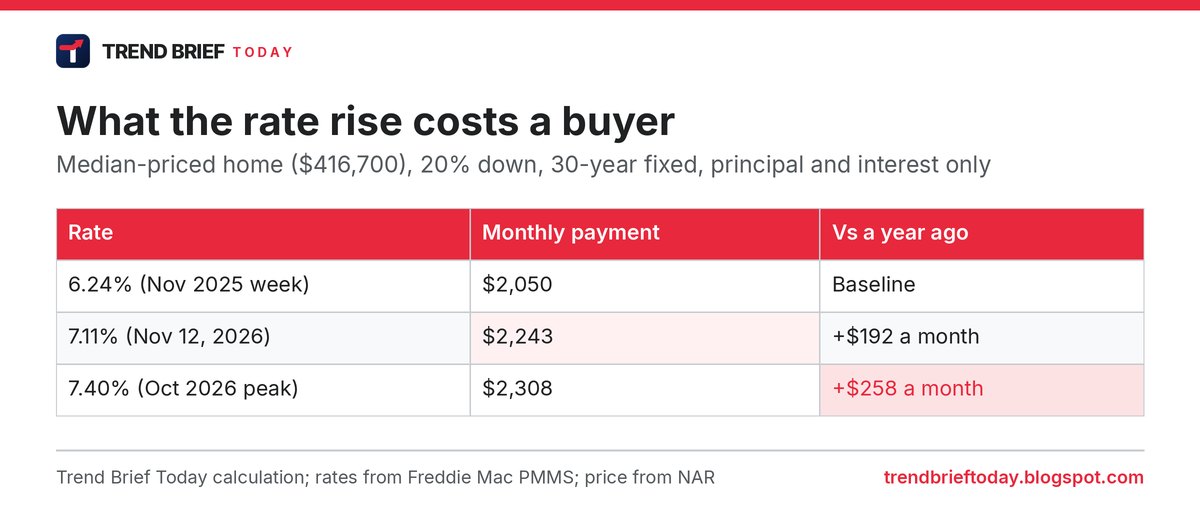
- Buyers: more homes on the market and longer selling times can give more room to negotiate on price, repairs or closing costs. A small rate drop also cuts the payment, so it is worth comparing lenders now that the weekly rate has fallen four times in a row.[1][8]
- Sellers: prices are still slightly up nationally but falling in the South and flat in the West, so local data matters more than the national headline.[1]
- Everyone: Yun says there could be "sizable pent-up demand if mortgage rates decline", because jobs are still growing while sales are at a 16-year low.[1]
Yun also said 2026 sales are likely to end below 2025's 4.06 million, which would be the weakest year in more than three decades.[2] This page is general information, not financial advice.
Frequently asked questions
Why are home sales so low in 2026?
Mostly because of mortgage rates. The 30-year rate averaged 7.33% in October, the highest since 2000 apart from one month in 2023, and prices are near record highs, so monthly payments are out of reach for many buyers.[1][2]
Are house prices falling?
Not nationally yet. The October median of $416,700 was 0.4% higher than a year ago. Prices did fall slightly in the South (-0.4%) and were flat in the West.[1][4]
What are mortgage rates today?
Freddie Mac's survey on November 12, 2026 put the average 30-year fixed rate at 7.11% and the 15-year at 6.45%.[8][9] Your own rate depends on your credit, deposit and lender.
When is the next existing-home sales report?
NAR publishes the report monthly at 10 a.m. Eastern Time, usually in the third or fourth week of the following month, so November figures are due in December. NAR's pending home sales index, which tracks signed contracts, comes out later each month and gives an earlier signal.[6]
References
- "Existing-Home Sales Decreased 5.5% in October, According to NAR Report". National Association of Realtors. November 12, 2026. nar.realtor
- "'A tough market': Home sales fall to lowest level since 2010 as high mortgage rates paralyze activity". Yahoo Finance. November 12, 2026. finance.yahoo.com
- "Existing home sales fall to 3.75 million pace in October". HousingWire. November 12, 2026. housingwire.com
- "U.S. existing home sales fell to lowest level since 2010 in October". Quartz. November 12, 2026. qz.com
- "NAR: Existing-Home Sales Decreased to 3.75 million SAAR in October; New Cycle Low". Calculated Risk. November 12, 2026. calculatedrisk.substack.com
- "US October existing home sales 3.75m vs 3.85m expected". investingLive. November 12, 2026. investinglive.com
- "Existing-Home Sales Increased 1.5% in September, According to NAR Report". National Association of Realtors. October 13, 2026. nar.realtor
- "30-Year Fixed Mortgage Rate Drops by 7 Basis Points" (Freddie Mac PMMS). Norada Real Estate. November 12, 2026. noradarealestate.com
- "Mortgage Rates Decline for Fourth Consecutive Week to 7.11%" (Freddie Mac release). Stock Titan. November 12, 2026. stocktitan.net
- "Home Sales in October Plummet to 16-Year Low". The Wall Street Journal. November 12, 2026. wsj.com
- "Sales of Existing US Homes Tumble to Lowest Level Since 2010". Bloomberg. November 12, 2026. bloomberg.com